

The housing market is heading in two directions –
downwards across much of the North Island, and upwards
across much of the South Island.
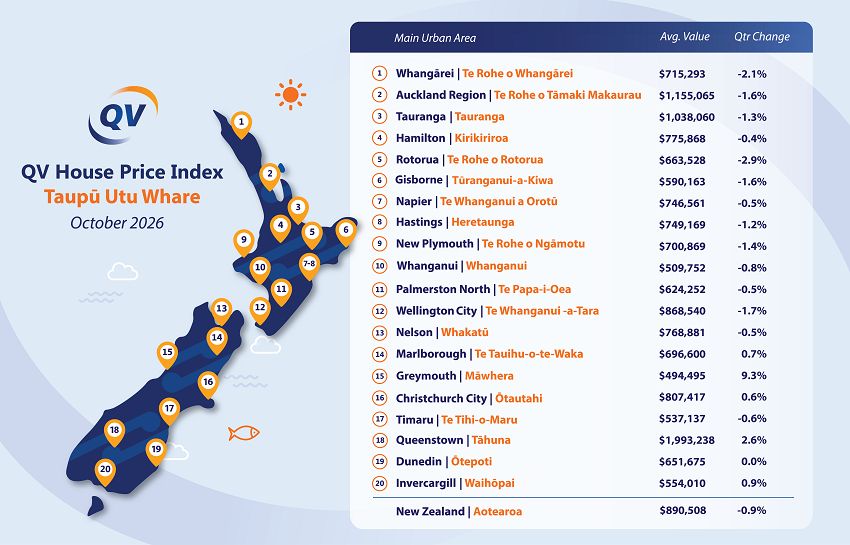
Our latest QV House
Price Index is a tale of two islands. It shows the national
average home value decreased by 0.9% to $890,508 in the
three months to the end of October – compared to a 1.5%
decline in September – with much of that weakness
concentrated in the north.
All of the North Island’s
main urban areas recorded declining home values this
quarter, with Rotorua (-2.9%), Whangārei (-2.1%),
Wellington (-1.7%) and Auckland (-1.6%) posting the largest
losses on average.
In contrast, average home values
were either flat or gently rising across much of the South
Island. Nelson (-0.5%) and Timaru (-0.6%) were the only main
urban areas to record quarterly declines.
QV national
spokesperson Simon Petersen said the divide between the two
islands had become increasingly pronounced.
“At a
national level, the housing market is still going backwards
– just more slowly now. But it’s not moving in unison.
The national figure hides a pretty clear divide between the
two islands.
“While much of the North Island remains
stuck in the same old holding pattern, with buyers generally
having plenty of choice and little reason to rush, parts of
the South Island are recording some relatively steady
growth.”
Mr Petersen said this divergence reflected
different local economic conditions, affordability, housing
supply and buyer demand.
Advertisement – scroll to continue reading
“What’s happening in
Auckland or Wellington right now looks quite different to
what we’re seeing in Christchurch and
Invercargill.
“These southern markets are benefiting
from stronger local economic conditions and relatively
better affordability, while our largest North Island markets
continue to face challenging conditions.”
He said
the traditional spring uplift in housing activity had so far
done little to shift that balance.
“Spring brings
more listings and more buyers into the market, but more
activity doesn’t necessarily translate to stronger prices.
Buyers still have the upper hand, particularly in the North
Island.
“Until that balance starts to shift a bit,
it’s difficult to see where any strong upward pressure on
values is going to come from.”
October’s QV House
Price Index figures captured the market in the weeks leading
up to the general election, which likely gave
already-cautious buyers and sellers just another reason to
wait and see.
“The election may now be behind us,
but the uncertainty clearly isn’t. Buyers and sellers will
still have to wait for greater clarity around the next
government and its policy direction.
“In the
meantime, the fundamentals affecting the housing market
remain the same. Employment confidence, borrowing costs,
affordability and the amount of property available for sale
will continue to influence buyer behaviour, regardless of
the political landscape,” Mr Petersen
said.
“Borrowing costs remain a crucial part of the
equation too. The Reserve Bank held the Official Cash Rate
at 2.75% in late October but has said that tighter monetary
policy is likely to be required.”
With just two
months of 2026 remaining, the national average home value is
now 2.2% lower than at the beginning of the
year.
“There’s still time for the market to make
up some ground before Christmas – but based on its current
trajectory it would take a fairly sharp turnaround for
average values to finish the year ahead of where they
started.
“That’s not the case across much of the
South Island, of course, where home values in most markets
are already pulling ahead.”
Northland
Once
again, Kaipara was a lone green arrow across the top of the
North Island this quarter.
Its average home value grew
by 1.9% to $844,500 in the three months to the end of
October 2026. That figure is now 2.8% higher than at the
start of this calendar year and 0.9% higher than the same
time last year.
Meanwhile, home values fell by an
average of 2.1% this quarter in Whangārei and by 4% in the
Far North. The average home in these districts is now worth
$715,293 and $666,817
respectively.
Auckland
Home values have
continued to drift lower across the Auckland region – with
one exception.
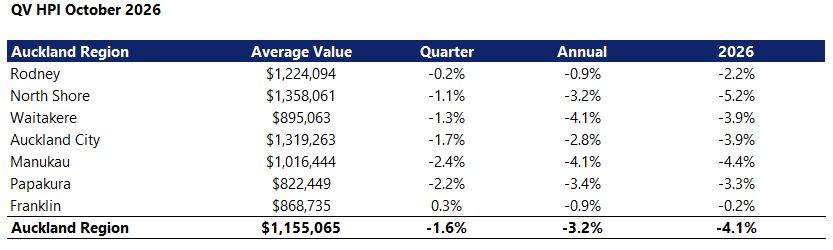
The average home in Franklin increased
in value by 0.3% over the quarter to $868,735. Otherwise all
of the Super City’s former council areas recorded average
declines, with Manukau (-2.4%) and Papakura (-2.2%)
recording the largest.
The average home in the region
is now worth $1,155,065, which is 4.1% lower than the start
of this year and 3.2% lower than the same time last
year.
Auckland-based
QV registered valuer Hugh Robson said there had been no
significant change in market conditions.
“Agents
continue to report quiet conditions across much of Auckland,
with low numbers at open homes and relatively low sales
volumes through October.
“There’s still a lot of
stock available, which means buyers generally have plenty of
choice and little reason to rush. The election has also
given some people another reason to sit back and wait to see
what happens next with housing policy and interest
rates.
“Despite that, price levels remained
relatively stable during October. We’re also continuing to
see developers start new multi-unit developments, even in
what remains a fairly slow market.
“At the upper
end, the $2 million-plus bracket remains relatively stable,
with steady sales activity.”
Bay of
Plenty
Home values have continued to drift lower
across most of the Bay of Plenty region.
The largest
fall on average occurred this quarter in Rotorua, where the
average home value decreased by 2.9% to $663,528. That
figure is now 2.5% lower than at the start of this calendar
year.
Home values in Tauranga have held up better,
reducing by an average of 1.3% this quarter. The average
home is now worth $1,038,060, which is 0.5% higher than at
the start of 2026 and 1.9% higher than the same time last
year.
Across the region, only Whakatane’s average
home value grew this quarter, up
1.5%.
Waikato
Residential property values
remain largely flat to gently falling across the
Waikato.
Our latest QV House Price Index shows values
decreased across the region by 0.8% in the three months to
the end of October, with the largest average decline
occurring in Taupo (-3.1%).
Hamilton performed
slightly better than average this quarter. Its average home
value reduced by 0.4% to $775,868. That compares to
quarterly declines of 1.6% and 1.2% in our August and
September indexes.
Local QV registered valuer Marshall
Wu said central and southwest Hamilton had shown
“tentative signs of stabilisation” with quarterly
increases of 1% and 1.9% respectively.
“These
movements may signal early recovery, supported by first-home
buyer and investor demand, CBD living opportunities in
central Hamilton and larger, affordable homes and
development sites in southwest Hamilton.”
He said
the general decline in values and reduced sales volumes
elsewhere indicated continued caution among market
participants.
“Uncertainty in the lead-up to the
2026 election may be influencing purchasing decisions. That
includes potential changes to property taxation, persistent
inflation and the broader economic outlook.
“While
improved affordability and greater purchasing choice are
supporting first-home buyer activity, the prospect of higher
mortgage rates may constrain demand and limit the pace of
any near-term recovery.”
Meanwhile, Waitomo was the
only Waikato district where home values grew on average this
quarter, rising 1% over the three months to the end of
October.
Hawke’s Bay
Home values are down
again in Napier and Hastings.
Our latest QV House
Price Index shows they have reduced by 1.2% in Hastings and
0.5% in Napier this quarter.
At $746,561, the average
home value in Napier is now 0.8% less than at the start of
this year and 1% lower than the same time last
year.
In Hastings, the average home value is $749,169,
which is 3.9% less than at the start of 2026 and 3.3% less
than the same time last
year.
Taranaki
Residential property values
have declined for six straight months now in New
Plymouth.
Our latest QV House Price Index shows the
city’s average home value is now sitting just above the
$700,000 mark, following a quarterly decline of 1.4%. The
average home value is now 2.5% lower than at the start of
this year.
It is a similar story in South Taranaki,
where the average home value has reduced by 1.4% to $456,722
this quarter. Stratford also recorded a decline, with values
decreasing by 2% on average to
$507,220.
Manawatu
Home values continue to
drift slightly downward in Palmerston North.
Our
latest QV House Price Index shows the city’s average home
value is now $624,252, following a quarterly decline of just
0.5%. The average home is now worth 1.9% less than at the
start of 2026.
Meanwhile, home values have reduced by
an average of 0.8% across the wider Manawatū region, with
the largest quarterly declines reported in Ruapehu (-4%) and
Tararua (-2%).
In Whanganui, the average home value
fell 0.8% to $509,752 this quarter. That figure is now 4.1%
lower than at the start of this calendar
year.
Wairarapa
It was a mixed bag across the
Wairarapa region this quarter.
Residential property
values increased by an average of 0.5% in Masterton and 1.5%
in Carterton, while falling by 2.9% in South
Wairarapa.
At $564,733, the average home value in
Masterton is now just 0.4% lower than at the start of this
calendar year. Carterton’s average home value is 2.2%
lower than at the start of 2026, at $598,596, while South
Wairarapa is 2.8% lower at
$715,765.
Wellington
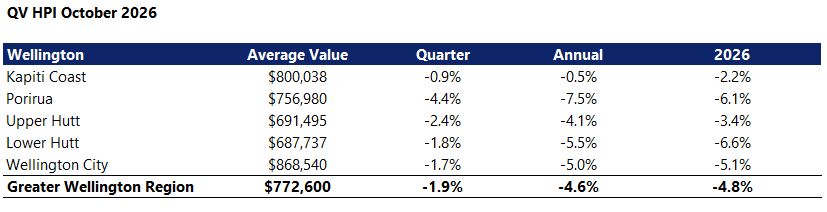
The rate of home value
decline has slowed in Wellington.
Our latest QV House
Price Index shows the region’s quarterly rate of decline
has eased from 3.2% in August to 3% in September and now
1.9% in October.
Home values have fallen furthest this
quarter in Porirua (-4.4%) and least on the Kāpiti Coast
(-0.9%).
Local
QV registered valuer David Cornford said the typical spring
uplift in market activity had been noticeably more subdued
than usual.
“The market continues to be soft and
values have continued to slide. Market activity is lower
compared to what it usually is at this time of year, most
likely down to the softer market and the
election.
“There are a high number of properties on
the market and this is contributing to the softer market as
vendors accept lower prices to secure a sale. Buyers are
taking their time and are not in a hurry. They have time to
shop around and find the best option for
them.”
“The economy is still showing little sign
of improvement, interest rates are expected to rise further
and this will likely be a headwind as we head into 2027,”
Mr Cornford
added.
Nelson/Tasman/Marlborough
There were
minor gains and losses across the top of the South Island
this quarter.
Our QV House Price Index for October
recorded average home value growth in Tasman (0.8%) and
Marlborough (0.7%), while Nelson declined slightly
(-0.5%).
On an annual basis, Tasman’s average home
value is now just 0.1% higher than the same time last year
at $824,149. Marlborough is up 0.5% at $696,600, while
Nelson is down 1.7% at $768,881.
QV Nelson/Marlborough
manager Craig Russell described it as “a flat residential
market, with most activity in the lower to medium price
bracket”.
“It’s an overall cautious market, with
uncertainty still prevalent in the lead-up to the election
and indications that the OCR will increase in the coming
months. Days to sell remain elevated, with the number of
sales slightly down on this time last year.”
“The
lifestyle property market is particularly weak above $1.2
million, while section sales remain subdued, with the cost
and time to build a key factor in purchasers’
decision-making,” he added.
West Coast
Home
values have increased across the wider West Coast region by
an average of 5.2% this quarter.
Westland District
recorded a quarterly increase of 5.3%, an average value of
$521,590 and a 6.3% increase from 12 months ago. That
compares to a decrease of 2.5% in the three months to the
end of September and a 6.8% decrease in the preceding period
to the end of August.
Grey District recorded an
increase for the three-month period to the end of October of
9.3%, an average value of $494,495 and a 6% increase from 12
months ago. For the previous three-month period to the end
of September, it saw a decrease of 1%, and a 3.7% decrease
for the preceding period to the end of August.
The
Buller District recorded a decrease of 1.4% for the
three-month period to the end of October, an average value
of $372,157, and a 6.2% decrease from 12 months ago. That
compares to a 1.6% decline in the three-month period to the
end of September and a 6.7% decrease in the preceding period
to the end of August.
Local QV registered valuer Rod
Thornton said these statistics indicate overall improvement
in the Westland and Grey markets, following on from a
subdued winter period.
“This follows the 2025/early
2026 period where there were consistent percentage/value
lifts, and the West Coast was outperforming many other
districts in this regard,” he said.
“In contrast,
the Buller District overall has not performed as well,
particularly the main town of Westport and surrounds, which
is largely due to uncertainty over the large Stockton coal
mine to the north of Westport.
“This is a major
employer, which is currently in a fast-track
consenting/approval process. This includes an extension to
the mine to allow for another 25 years of production, up
from reportedly around three years remaining at current
production on its current footprint.
“As could be
expected in a market like the West Coast, there is a wide
mix of housing types, locations, price points and value
drivers, including within a district’s towns and areas, so
this index gives a ‘broad brush’ overview,” Mr
Thornton concluded.
Canterbury
Home values are
up on average in Canterbury – but not
everywhere.
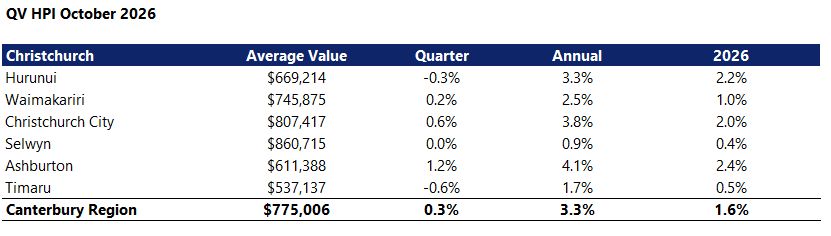
Our latest QV House Price Index shows the
average home value has increased by 0.3% across the wider
region this quarter, with modest gains recorded in
Waimakariri (0.2%), Christchurch (0.6%) and Ashburton
(1.2%).
Home values reduced by 0.3% this quarter in
Hurunui, remained flat in Selwyn, and fell by 0.6% in
Timaru. However, average home values remain higher on both
an annual and calendar year basis across all of these
areas.
The average home value in Christchurch is now
$807,417, which is 2% higher than at the start of this year
and 3.8% higher than at the same time last year.
QV
South Island professional services manager Michael Tohill
said the number of real estate listings had increased into
spring.
“Higher inventory means buyers have more
choices, putting greater emphasis on proper property
presentation and realistic vendor pricing, rather than fast,
unconditional bidding wars.
“First-home buyers
remain one of the most active segments across Canterbury and
New Zealand as a whole, benefiting from steady home loan
interest rates and flexible lending
tiers.”
“Mortgage and home loan rates have
remained mostly flat through recent months despite ongoing
debates around the Reserve Bank’s Official Cash Rate (OCR)
path,” he
added.